
MIS Report Automation: Excel + AI, Dashboard, VBA and Power BI
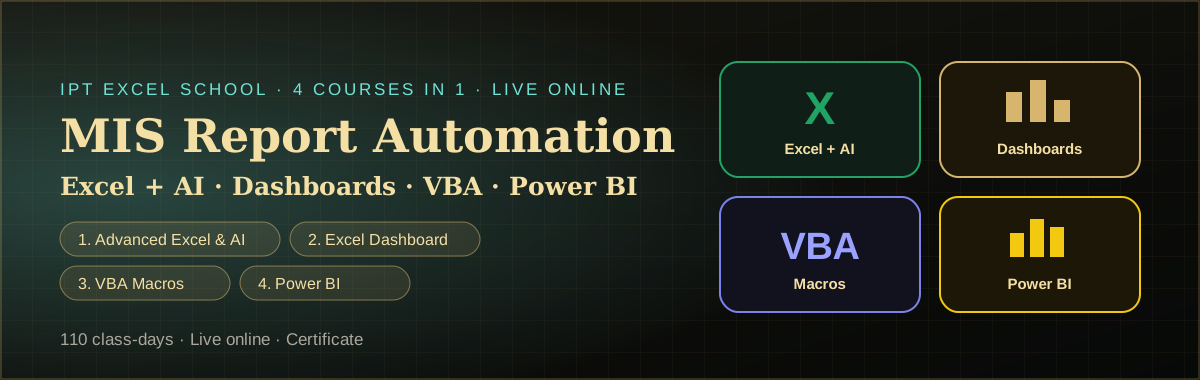
Four courses in one: Advanced Excel with AI, Excel Dashboard Masterclass, VBA Macros and Power BI Developer. 110 class-days of live online training to automate MIS reports, with real projects and a certificate. Free demo class. Contact Sujeet Sir for fees.

Four courses, one MIS automation path

Sujeet Sir
21 Years Exp.
Excel | VBA | Power BI | SQL | Python
Data Analytics Expert & Corporate Trainer
- Sujeet Kumar Singh (MCA), founder of IPT Excel School since 2007
- Worked as MIS Executive and VBA Developer in 10+ companies
- Report consultant for 40+ organizations
What you will learn
Shortcuts, formatting, protection, Flash Fill, Analyze Data and Copilot.
Lookup, logical, text, date, dynamic array, LET and LAMBDA.
Slicers, timelines, data models, clean and merge data.
Sales, finance, HR, inventory, support, healthcare and CEO dashboards.
Loops, UserForms, email, Word/PDF and database automation.
Auto report, data entry form, bulk email, dashboard maker, complete solution.
Star schema, DAX, Power Query M, RLS, gateway, deployment pipeline.
Raw data > Power Query > model > dashboard > VBA / Power BI refresh > AI insights.
BENEFITS
- Learn Excel, dashboards, VBA and Power BI in one course
- Automate daily, weekly and monthly MIS reports
- Build 40+ real dashboards and 5 VBA automation projects
- Finish with real projects, a certification test and a certificate
YOUR GOAL
Become an MIS expert who can collect raw data, build dashboards and send automated reports without manual work.
WHO SHOULD LEARN
Students, MIS executives, accountants, data analysts and office staff who want to work faster and grow their career.
COURSE OUTLINE
⬇ Download PDFCourse 1 - Advanced Excel & AI (25 days)
Excel foundations, formulas, pivot, dashboards, Power Query and Copilot
Week 1 - Excel Foundations & Speed
- Day 1 : Excel Advanced Basics: advanced selection, shortcuts, workbook and file settings
- Day 2 : Advanced Formatting: custom and conditional formatting
- Day 3 : Advanced Data Handling: copy/paste, Paste Special, data protection
- Day 4 : Advanced Data Formatting: custom and conditional formatting
- Day 5 : Excel AI: Flash Fill, Analyze Data, built-in AI
- Project 1 : Clean and formatted data entry sheet using Tables and Named Ranges
Week 2 - Formulas, Logic & Lookups (300+ formulas)
- Day 6 : Basic formulas: 100+ basic formulas
- Day 7 : Logical functions: IF, IFS, AND, OR, XOR, IFERROR
- Day 8 : Text and Date-Time formulas
- Day 9 : Lookup methods: VLOOKUP, MATCH, INDEX, OFFSET, XLOOKUP, FILTER
- Day 10 : Advanced formulas: array formulas, LET, HSTACK, VSTACK and more
- Project 2 : Live data report using Logic + Lookup + Dynamic Array formulas
Week 3 - Pivot Tables & Advanced Data Analysis
- Day 11 : Pivot Table basics: create, group, filter and summarize
- Day 12 : Advanced Pivot Tables: calculated fields, calculated items, custom calculations
- Day 13 : Pivot Charts, Slicers and Timelines
- Day 14 : What-If Analysis: Goal Seek, Data Tables, Scenario Manager
- Day 15 : Formula auditing, error checking, trace precedents and dependents
- Project 3 : Sales / HR analysis report using Pivot Tables and What-If Analysis
Week 4 - Dashboard & Professional Reporting
- Day 16 : Dashboard design principles, KPI selection and layout planning
- Day 17 : Dashboard building using shapes, icons, controls and interactive elements
- Day 18 : Interactive dashboards: slicers and multiple pivot tables
- Day 19 : Advanced charts: combo, dynamic charts, sparklines, KPI charts
- Day 20 : Real-time / live data dashboards and dashboard storytelling
- Project 4 : Complete interactive business dashboard (Sales / HR / E-commerce)
Week 5 - Power Query, Power Pivot, DAX & AI
- Day 21 : Power Query: importing, cleaning and transforming data
- Day 22 : Power Query: merge, append, multiple files and automated preparation
- Day 23 : Power Pivot and data modeling: relationships and DAX fundamentals
- Day 24 : DAX reporting and Microsoft Copilot / AI in Excel: analysis, formulas, cleaning
- Day 25 : Final capstone project, AI-assisted reporting and certification test
- Final Project : End-to-end business solution: Raw Data > Power Query > Data Model > DAX > Dashboard > AI Insights
Course 2 - Excel Dashboard Masterclass (30 days)
30-day plan, 40+ real-world dashboards with real business data
Level 1 - Foundation (Days 1-5)
- Day 1 : Dashboard fundamentals, data structure and KPI design: Sales Performance Dashboard
- Day 2 : Product Sales and Product Profitability Dashboard
- Day 3 : Branch and Regional Performance Dashboard
- Day 4 : Customer Analysis and Segmentation Dashboard
- Day 5 : Monthly Sales Trend and Seasonality Dashboard
Level 2 - Interactive Dashboards (Days 6-10)
- Day 6 : Sales Target vs Achievement Dashboard
- Day 7 : Interactive Pivot Dashboard with Slicers and Timeline
- Day 8 : Executive KPI Scorecard Dashboard
- Day 9 : Marketing Campaign Performance Dashboard
- Day 10 : Digital Marketing and ROI Dashboard
Level 3 - Professional MIS (Days 11-15)
- Day 11 : Revenue and Expense Dashboard
- Day 12 : Profit and Loss Dashboard
- Day 13 : Budget vs Actual Dashboard
- Day 14 : Receivables, Payables and Collection Dashboard
- Day 15 : Inventory and Stock Ageing Dashboard
Level 4 - Department Dashboards (Days 16-20)
- Day 16 : Purchase and Supplier Performance Dashboard
- Day 17 : HR Analytics Dashboard
- Day 18 : Recruitment and Hiring Funnel Dashboard
- Day 19 : Attendance and Workforce Productivity Dashboard
- Day 20 : Payroll and Compensation Dashboard
Level 5 - Customer & Industry (Days 21-25)
- Day 21 : Customer Service and Complaint Dashboard
- Day 22 : Call Center and SLA Performance Dashboard
- Day 23 : E-Commerce Sales and Returns Dashboard
- Day 24 : Logistics and Delivery Performance Dashboard
- Day 25 : Banking and Loan Collection Dashboard
Level 6 - Advanced & Executive (Days 26-30)
- Day 26 : Hospital and Healthcare Operations Dashboard
- Day 27 : Education / Institute Performance Dashboard
- Day 28 : Manufacturing, Production and Quality Dashboard
- Day 29 : Multi-Department MIS Dashboard
- Day 30 : CEO Executive Dashboard: Final Capstone Project
Course 3 - Excel VBA Macros (25 days)
Automate reports, forms, emails and dashboards with VBA
Week 1 - VBA Macros Basic
- Day 1 : VBA basics and macro concept
- Day 2 : Recording macros with editing
- Day 3 : Workbook, Sheets and Range object
- Day 4 : File and folder handling with VBA
- Day 5 : Formatting, style and report format
Week 2 - Loops, Conditions & Events
- Day 6 : Formatting tricks and variables
- Day 7 : Simple IF, AND, OR and XOR
- Day 8 : Nested If and Select Case
- Day 9 : For, For Each and Do While loops
- Day 10 : Do Until loop and loop project
Week 3 - Functions & UserForm
- Day 11 : VBA functions (custom functions)
- Day 12 : Advanced formulas with VBA
- Day 13 : String, number and date functions
- Day 14 : Lookup functions (VLookup, HLookup)
- Day 15 : UserForm basics (controls)
Week 4 - Database Connectivity & Other Applications
- Day 16 : Database connectivity (Access, SQL)
- Day 17 : Outlook and Gmail (email automation)
- Day 18 : Word and PDF automation
- Day 19 : Web and Notepad connectivity
- Day 20 : Other applications (charts, pivot)
Week 5 - 5 Automation Projects
- Day 21 : Project 1: Auto Report
- Day 22 : Project 2: Data Entry Form
- Day 23 : Project 3: Bulk Email System
- Day 24 : Project 4: Dashboard Maker
- Day 25 : Project 5: Complete Solution
Course 4 - Power BI Developer (30 days)
Data modeling, DAX, Power Query M, service, security and automation
Week 1 - Power BI Foundation & Data Preparation
- Day 1 : Power BI architecture and Desktop
- Day 2 : Power Query and data transformation
- Day 3 : Power Query M and query folding
- Day 4 : Data modeling and star schema
- Day 5 : Relationships and date table
- Project : Sales Data Model
Week 2 - DAX & Visualization
- Day 6 : DAX fundamentals
- Day 7 : CALCULATE and filter context
- Day 8 : Advanced DAX
- Day 9 : Time intelligence
- Day 10 : Advanced visualization
- Project : Management Dashboard
Week 3 - Developer-Level Semantic Model
- Day 11 : Advanced data modeling
- Day 12 : DAX optimization
- Day 13 : Performance Analyzer and DAX Studio
- Day 14 : Tabular Editor and calculation groups
- Day 15 : Dynamic measures and advanced KPIs
- Project : Enterprise Semantic Model
Week 4 - Power BI Service / Enterprise
- Day 16 : Workspace and apps
- Day 17 : Gateway and scheduled refresh
- Day 18 : Incremental refresh and parameters
- Day 19 : RLS, dynamic RLS and OLS
- Day 20 : Deployment pipeline
- Project : Dev > Test > Production
Week 5 - Power BI Developer (Advanced Tools & Integration)
- Day 21 : REST API (automation and integration)
- Day 22 : Power BI Embedded (app owns data / user owns data)
- Day 23 : PBIP, Git and Azure DevOps (version control)
- Day 24 : Paginated reports and Report Builder
- Day 25 : Python / R (advanced)
- Project : Final Developer Project
Week 6 - New Advanced Modules (Enterprise & Future Ready)
- Day 26 : Bookmarks, drillthrough pages and what-if parameters
- Day 27 : Dataflows and datamarts (reusable ETL and self-service)
- Day 28 : Power BI Premium / capacity (licensing and workspace)
- Day 29 : Copilot and AI visuals in Power BI
- Day 30 : Power Automate integration (alerts and workflow)
- Project : Enterprise Solution with AI and Automation
Formulas covered (300 to 500)
IF, IFS, LET, LAMBDA, BYCOL, BYROW, SCAN, REDUCE, MAP, MAKEARRAY, XLOOKUP, INDEX and MATCH, FILTER, SUMIFS, COUNTIFS, text, date and time functions, and the new 2025-26 functions: VSTACK, HSTACK, CHOOSECOLS, CHOOSEROWS, TAKE, DROP, WRAPROWS, WRAPCOLS, GROUPBY, PIVOTBY, TRIMRANGE, TEXTSPLIT, TEXTBEFORE, TEXTAFTER, REGEXEXTRACT, REGEXREPLACE, REGEXTEST, TRANSLATE and Python in Excel (PY).
COURSE DETAILS
| Courses | Advanced Excel & AI (25 days) + Excel Dashboard (30 days) + VBA Macros (25 days) + Power BI (30 days) |
|---|---|
| Total | 110 class-days, day-wise plan in the outline |
| Level | Expert |
| Batch size | 1 to 3 students (one-to-one or small group) |
| Mode | Live online on Google Meet |
| Language | Hindi or English |
| Projects | Weekly projects, 5 VBA automation projects, Power BI projects and a certification test |
| Certificate | Yes, with real project work |
| Support | Phone and Google Meet doubt support |
| Demo | Free 3-4 day demo class |
| Fees | Contact Sujeet Sir: +91 88025 79388 |
HOW IT IS TAUGHT
Live on Google Meet by Sujeet Sir in Hindi or English, with real company examples, projects, a certificate and doubt support on phone after the course.
Join a free demo
Questions about this course
What is the fee of the MIS Report Automation course?
Fees depend on one-to-one or group batch. Contact Sujeet Sir on +91 88025 79388 or WhatsApp for the current fee.
What is included in this course?
Four courses in one: Advanced Excel & AI (25 days), Excel Dashboard Masterclass (30 days), VBA Macros (25 days) and Power BI Developer (30 days).
Is there a free demo?
Yes. Join the 3-4 day free demo before you pay.
Which language is it taught in?
Hindi or English, as you prefer.